Online area chart maker
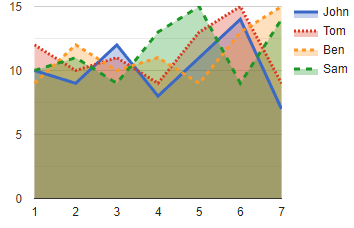
On this page, area charts with a maximum of 8 series can be created.
The data can be entered in rows, columns or as a table. Please read the description below.
The text of the X axis category must always be entered as a list (one category per line).
|
To create the diagram, you can enter the data as a table, line by line or as lists. Which input you prefer depends on the format of your data.
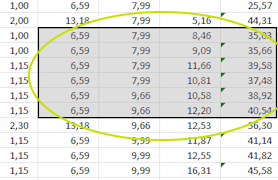
If you are copying data from a file, you can paste the data line by line into the first panel under the 'Series as table or list' selection (maximum 8 values per line). Each value represents a series. The data of a series are the values that are in a column one below the other.
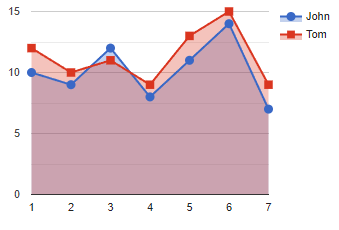
Data blocks with up to 8 columns can be copied from tables such as Excel and pasted into the editor. In the example below, a 4-column data block is inserted.

The data can be inserted as a list in the next two panels. Each list contains the data of one series.
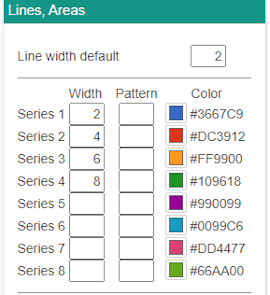
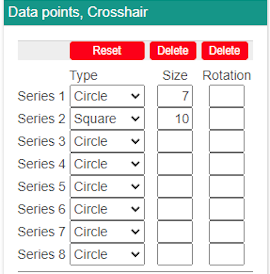
The width of the line can be set separately for each series. If no value is specified in the series, the value specified under Default is used.
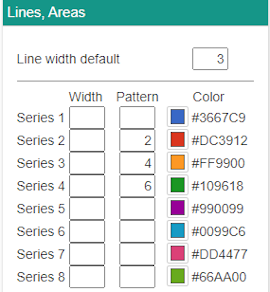
Dotted or dashed line pattern can be set for each series. The specified value determines the length of the dashes and the space. If no value is specified in the series, a solid line is drawn.
|
|