Axis Functions
Scaling the X and Y axes of a plot box
Description
The function \(AxisX\) defines the range of the X-scale of a plot box.
The function \(AxisY\) defines the range of the Y-scale of a plot box.
The scaling of the axes of a drawing plane in the plot box is performed automatically. The range of scales is calculated so that the axes slightly exceed the positions of the contained points. Mostly it is rounded up to the next whole value.
For example, if you draw a curve whose Y values are between 0.8 and 4.3, the Y axis is likely to be set from 0 to 5.
Adaptation of an axis
For a curve with values from 0 to 4.3, the Y-axis is likely to automatically scale from -1 to 5. To obtain an axis from 0 to 5, the scale can be scaled manually by calling the function AxisY (0,5).
Syntax
AxisX (min, max)
AxisX (min, max, id)
AxisY (min, max)
AxisY (min, max, id)
Parameters
min
Sets the minimum value of the scale
max
Sets the maximum value of the scale
Optional Parameters
id
Id number of the plot box, if more than one box is open on the worksheet.
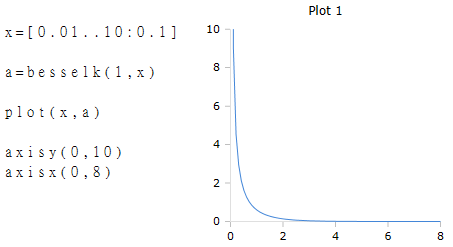
Show section of a curve
The range of the scale can also be defined smaller than the range of contained data. This will only show a specific area of a curve.
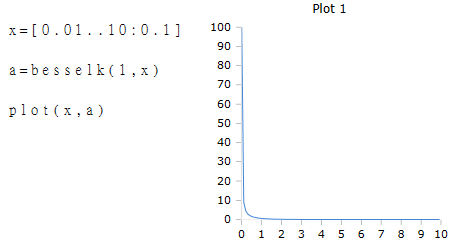
Example
The following figure shows the complete range of a BesselK function.
The next figure shows a section of the curve by limiting the X and Y axes.
Generator Funktionen
|
|