Rect Function
Draw a rectangle
Description
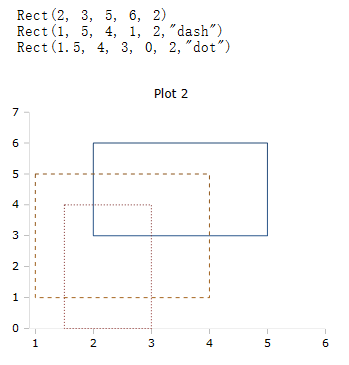
The \(Rect\) function draws a rectangle between the specified x and y coordinates.
Syntax
Rect (x1, y1, x2, y2)
Rect (x1, y1, x2, y2, id)
Rect (x1, y1, x2, y2, options)
Rect (x1, y1, x2, y2, id, options)
Parameter variants
Rect (x1, y1, x2, y2)
Draw a rectangle between the specified coordinates.
Rect (x1, y1, x2, y2, id)
Draw a rectangle between the specified coordinates. If the worksheet contains multiple plot boxes, the number of the optional parameter id determines in which box the rectangle will be displayed.
Rect (x1, y1, x2, y2, "dash")
The line type can be changed to solid, dash and dot in (solid, dashed and dotted).
Rect (x1, y1, x2, y2, "title:Name")
Title: changes the text in the legend.
Rect (x1, y1, x2, y2, "thickness:3")
Thickness: changes the width of the line; in this example, to three pixels.
Rect (x1, y1, x2, y2, "color:#rrggbb")
Color: # changes the color of the line. The color is given in 6 hexadecimal numbers for red, green and blue
Example
Generator Funktionen
|
|