Bubble Function
Drawing bubbles in the plot box
Description
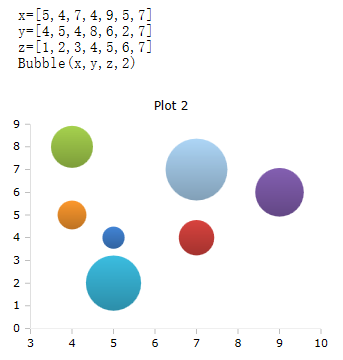
The \(Bubble\) function draws bubbles in a plot box. Three lists are expected as parameters, for the X-positions, the Y-positions and the size.
Syntax
Bubble (list x, list y, list z)
Bubble (list x, list y, list z, id)
Parameters
Liste x
A list of the X positions of the bubbles.
Liste y
A list of the Y-positions of the bubbles.
Liste z
A list of sizes of bubbles.
The specification of the size z is not an absolute value, but approximately represents the ratio of the values to one another. A z-list with the values 200, 500, and 800 will show bubbles the same size as a list with the values 20, 50, and 80.
Optional parameters
id
Id number of the plot box, if more than one box is open on the worksheet.
Example
Generator Funktionen
|
|