Chart Legend
Description of the chart legend settings
Chart Legend Settings |
|
|
The chart legend can be displayed in different positions in the chartbox. It shows as information the names or the properties of the different series. To set the properties click the button Legend settings. This opens a dialog panel for changing the properties: series names, colors and legend position. |
|
|
|
|
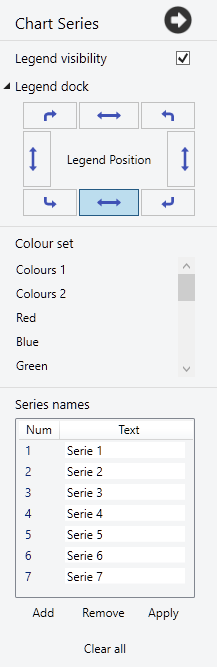
PropertiesLegend visibilityShows or hides the legend. Legend dockDetermines the legend position. Colour setChooses one of the pre-set colour sets. Series namesChanges the series names. |
|
|
See also Chart Box, Chart Type , Chart Options, X-Axis, Y-Axis |
|
Other graphics and design
| Charts | Displays results graphically |
| Chart types | Choose the chart type |
| Chart legend | Change the chart legend |
| Chart x-axis | Change chart x-axis settings |
| Chart y-axis | Change chart y-axis settings |
| Chart options | Change the chart options |
| Text | Insert text or a text file in a text box |
| Image | Insert images from clipboard or files |
| Slider | Insert a slider as a variable |
| Label | Insert label in chart oder image |
| Plot | Insert a plot box |
| Tables | Display of tables |
| Print the worksheet |
|
|