Chart Options
Description of the Chart Options settings
|
||||
|
The "Chart settings" button opens a dialog to change the chart options. |
||||
|
|
||||
TitleIn "Title text" you can insert a chart box headline. Additionally you can change the text size and colour. |
 |
|||
BorderDetermines the border width and colour. |
||||
BackgroundBackground colour setting. |
||||
Cross lineDisplays crosslines at the null positions of axes. |
||||
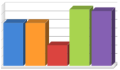
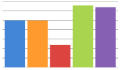
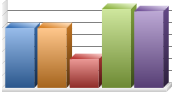
View 3DEnable or disable 3D design. 3D: |
||||
2D: |
||||
ShadowEnable or disable the plot area shadow. |
||||
ScrollbarsEnables a scrollbar. The scrollbar is only visible if the chart contains a large amount of data points. |
||||
ZoomToggles the zoom feature on or off. |
||||
LabelShows or hides labels at the data points. |
||||
AxisShows or hides axes. |
||||
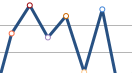
MarkerShows or hides markers at the data points. on: |
||||
LightingEnables or disables the lighting effect. on: |
||||
Light weightDeactivates some features to provide performance boost for large number of data points. |
||||
ThemeThere are 5 built-in themes provided with different features. |
||||
ZoomEnabled or disabled the zoom feature. If the zoom ist switched on, the x-axis displays a scrollbar for chart moving and scaling. |
||||
|
See also:
Chart Box,
Chart Legend,
Chart Type,
Chart X-Axes,
Chart Y-Axes
|
||||
 off:
off: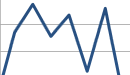
 off:
off: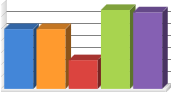
Other graphics and design
| Charts | Displays results graphically |
| Chart types | Choose the chart type |
| Chart legend | Change the chart legend |
| Chart x-axis | Change chart x-axis settings |
| Chart y-axis | Change chart y-axis settings |
| Chart options | Change the chart options |
| Text | Insert text or a text file in a text box |
| Image | Insert images from clipboard or files |
| Slider | Insert a slider as a variable |
| Label | Insert label in chart oder image |
| Plot | Insert a plot box |
| Tables | Display of tables |
| Print the worksheet |
|
|