Chart Types
Description of the Chart Types in RedCrab Calculator
Chart Types
|
||
|
||
|
|
||
Chart Type Panel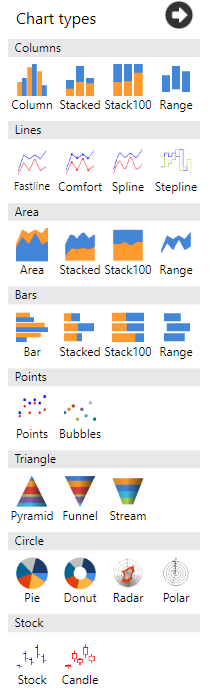
Columns
Column chart Lines
Fast line chart Area
Area chart Bars
Bar chart Points
Point chart Triangle
Pyramid chart Circle
Pie chart Stock
Stock chart |
||
|
See also: Chart Box, Chart Legend, Chart X-Axes, Chart Y-Axes, Chart Options |
||
Other graphics and design
| Charts | Displays results graphically |
| Chart types | Choose the chart type |
| Chart legend | Change the chart legend |
| Chart x-axis | Change chart x-axis settings |
| Chart y-axis | Change chart y-axis settings |
| Chart options | Change the chart options |
| Text | Insert text or a text file in a text box |
| Image | Insert images from clipboard or files |
| Slider | Insert a slider as a variable |
| Label | Insert label in chart oder image |
| Plot | Insert a plot box |
| Tables | Display of tables |
| Print the worksheet |
|
|