Plot Results
Description how to display function results as 2D plot in RedCrab Calculator
|
||||
|
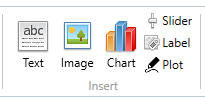
Plot boxes displays results graphically as 2D drawing To insert a plot box, select a range on the worksheet and click the Plot button in the menu group Insert. |
||||
|
||||
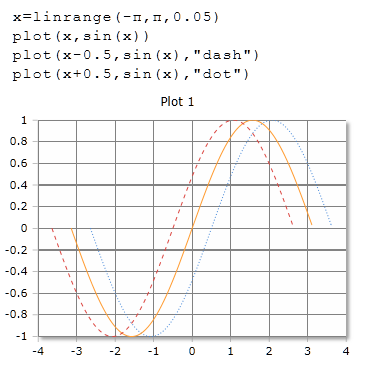
ExampleThe following example shows how to draw results with the function Plot |
||||
 |
||||
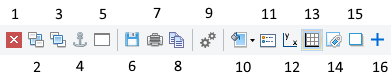
The Plot Toolbar |
||||
|
||||
| 1 | Deletes the box. | |||
| 2 | Sends the box to the background. | |||
| 3 | Brings the box in front. | |||
| 4 | Anchored the position of the box with another box. | |||
| 5 | Displays the box in a separate window. | |||
| 6 | Save the plot to a file | |||
| 7 | Print the plot | |||
| 8 | Send the plot to the clipboard | |||
| 9 | Change the plot settings | |||
| 10 | Change the plot box background | |||
| 11 | Show the legend | |||
| 12 | Show the axes | |||
| 13 | Show the grid | |||
| 14 | Show the data point labels | |||
| 15 | Show a shadow around the plot area | |||
| 16 | Show a crosshair on the axes null position | |||
|
|
||||
Other graphics and design
| Charts | Displays results graphically |
| Chart types | Choose the chart type |
| Chart legend | Change the chart legend |
| Chart x-axis | Change chart x-axis settings |
| Chart y-axis | Change chart y-axis settings |
| Chart options | Change the chart options |
| Text | Insert text or a text file in a text box |
| Image | Insert images from clipboard or files |
| Slider | Insert a slider as a variable |
| Label | Insert label in chart oder image |
| Plot | Insert a plot box |
| Tables | Display of tables |
| Print the worksheet |
|
|